Historian Web Interface
To see the Data Historian in the 1NCE OS, open the Device Inspector and select a device.
The device History is presented like this chart:
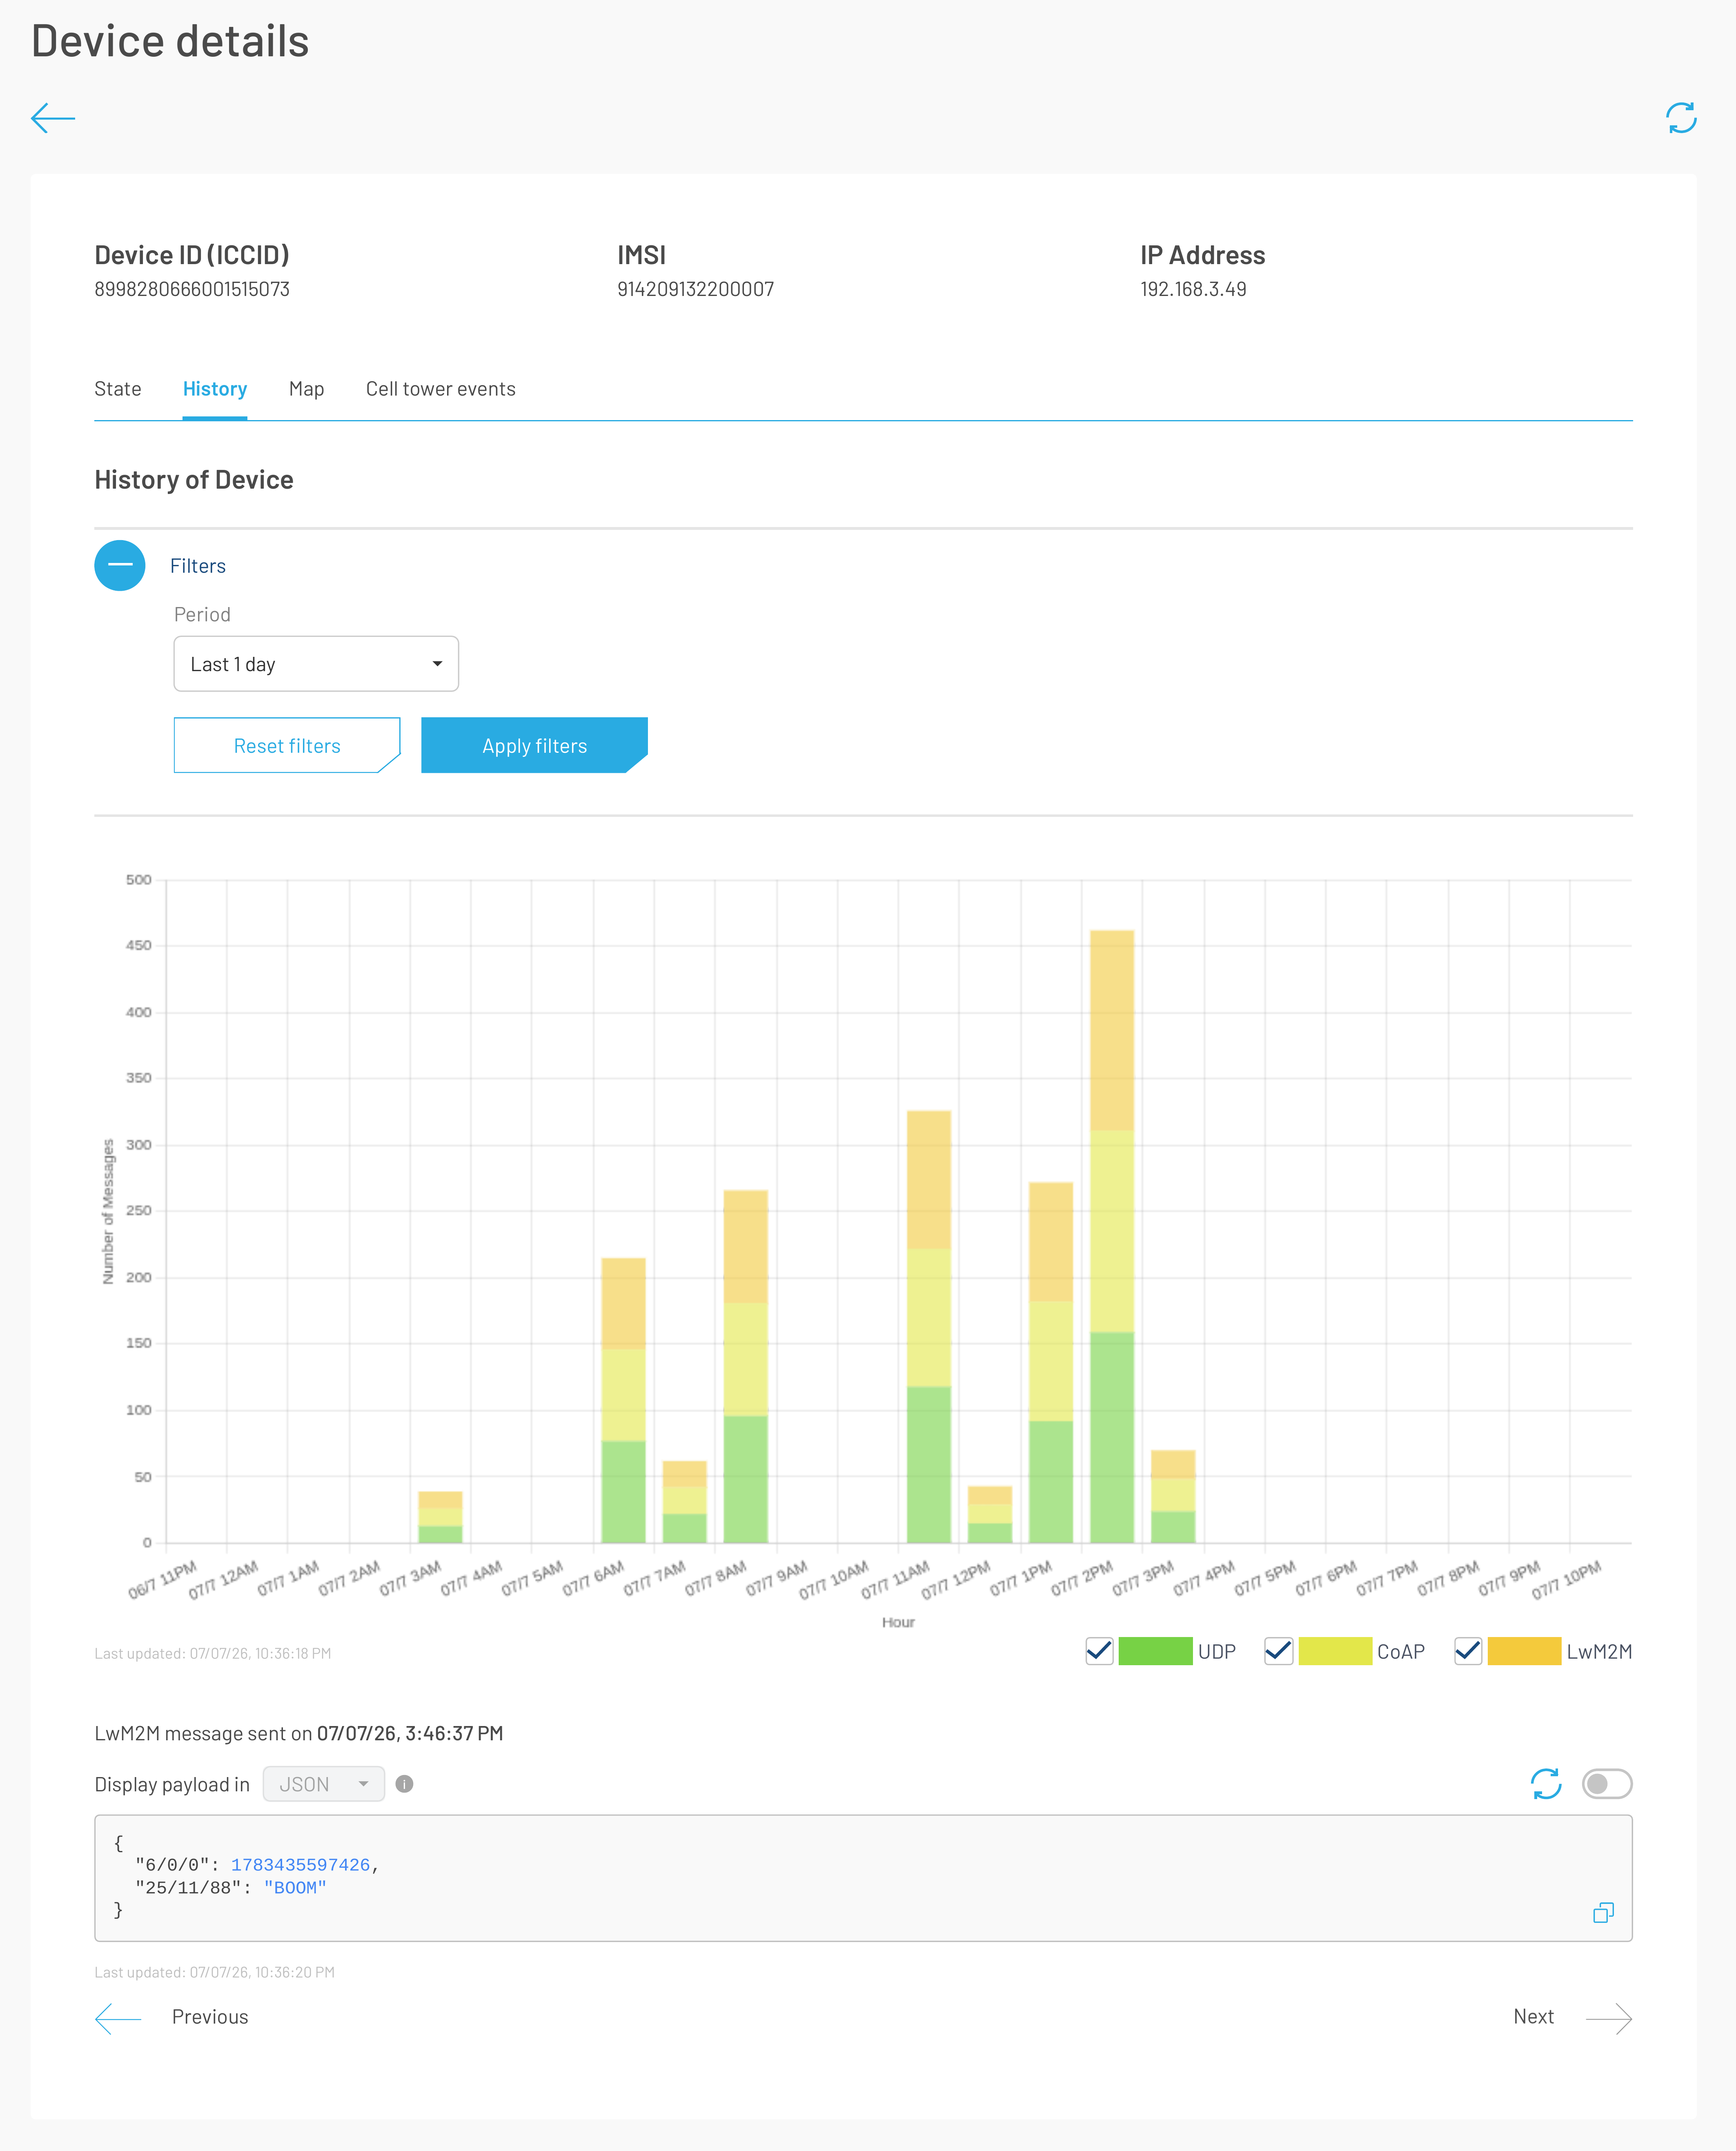
On the horizontal axis, we can see the dates or hours, depending on if we selected the last day or the last 7 days. On the vertical axis, there is the total message amount per day/hour. The bars are split into multiple colored sections. Each section represents message count by a specific source protocol (UDP, CoAP, or LwM2M). The user can toggle protocols shown by clicking on the protocol labels under the chart.
In the picture above, we have the last 1 day selected. At 11 AM, there were 4 CoAP messages and 4 LwM2M messages sent by this device. To see the message payload details, click on the colored bar of the required protocol. The latest LwM2M message sent by the device at 5:09:32 PM is shown, and its payload is visible and can be quickly copied by clicking the copy button. We can cycle through the individual payloads by clicking the “Previous” and “Next” buttons.
By default, the portal tries to convert Base64 messages to JSON format. If the received content is not valid JSON, the portal will display the original message as Base64. If the user has enabled the energy saver feature with a valid template for transforming payload into JSON, the portal will display message as a JSON and, if the message is not tranformable with the existing energy saver template, there will be an admin log created with the error message.
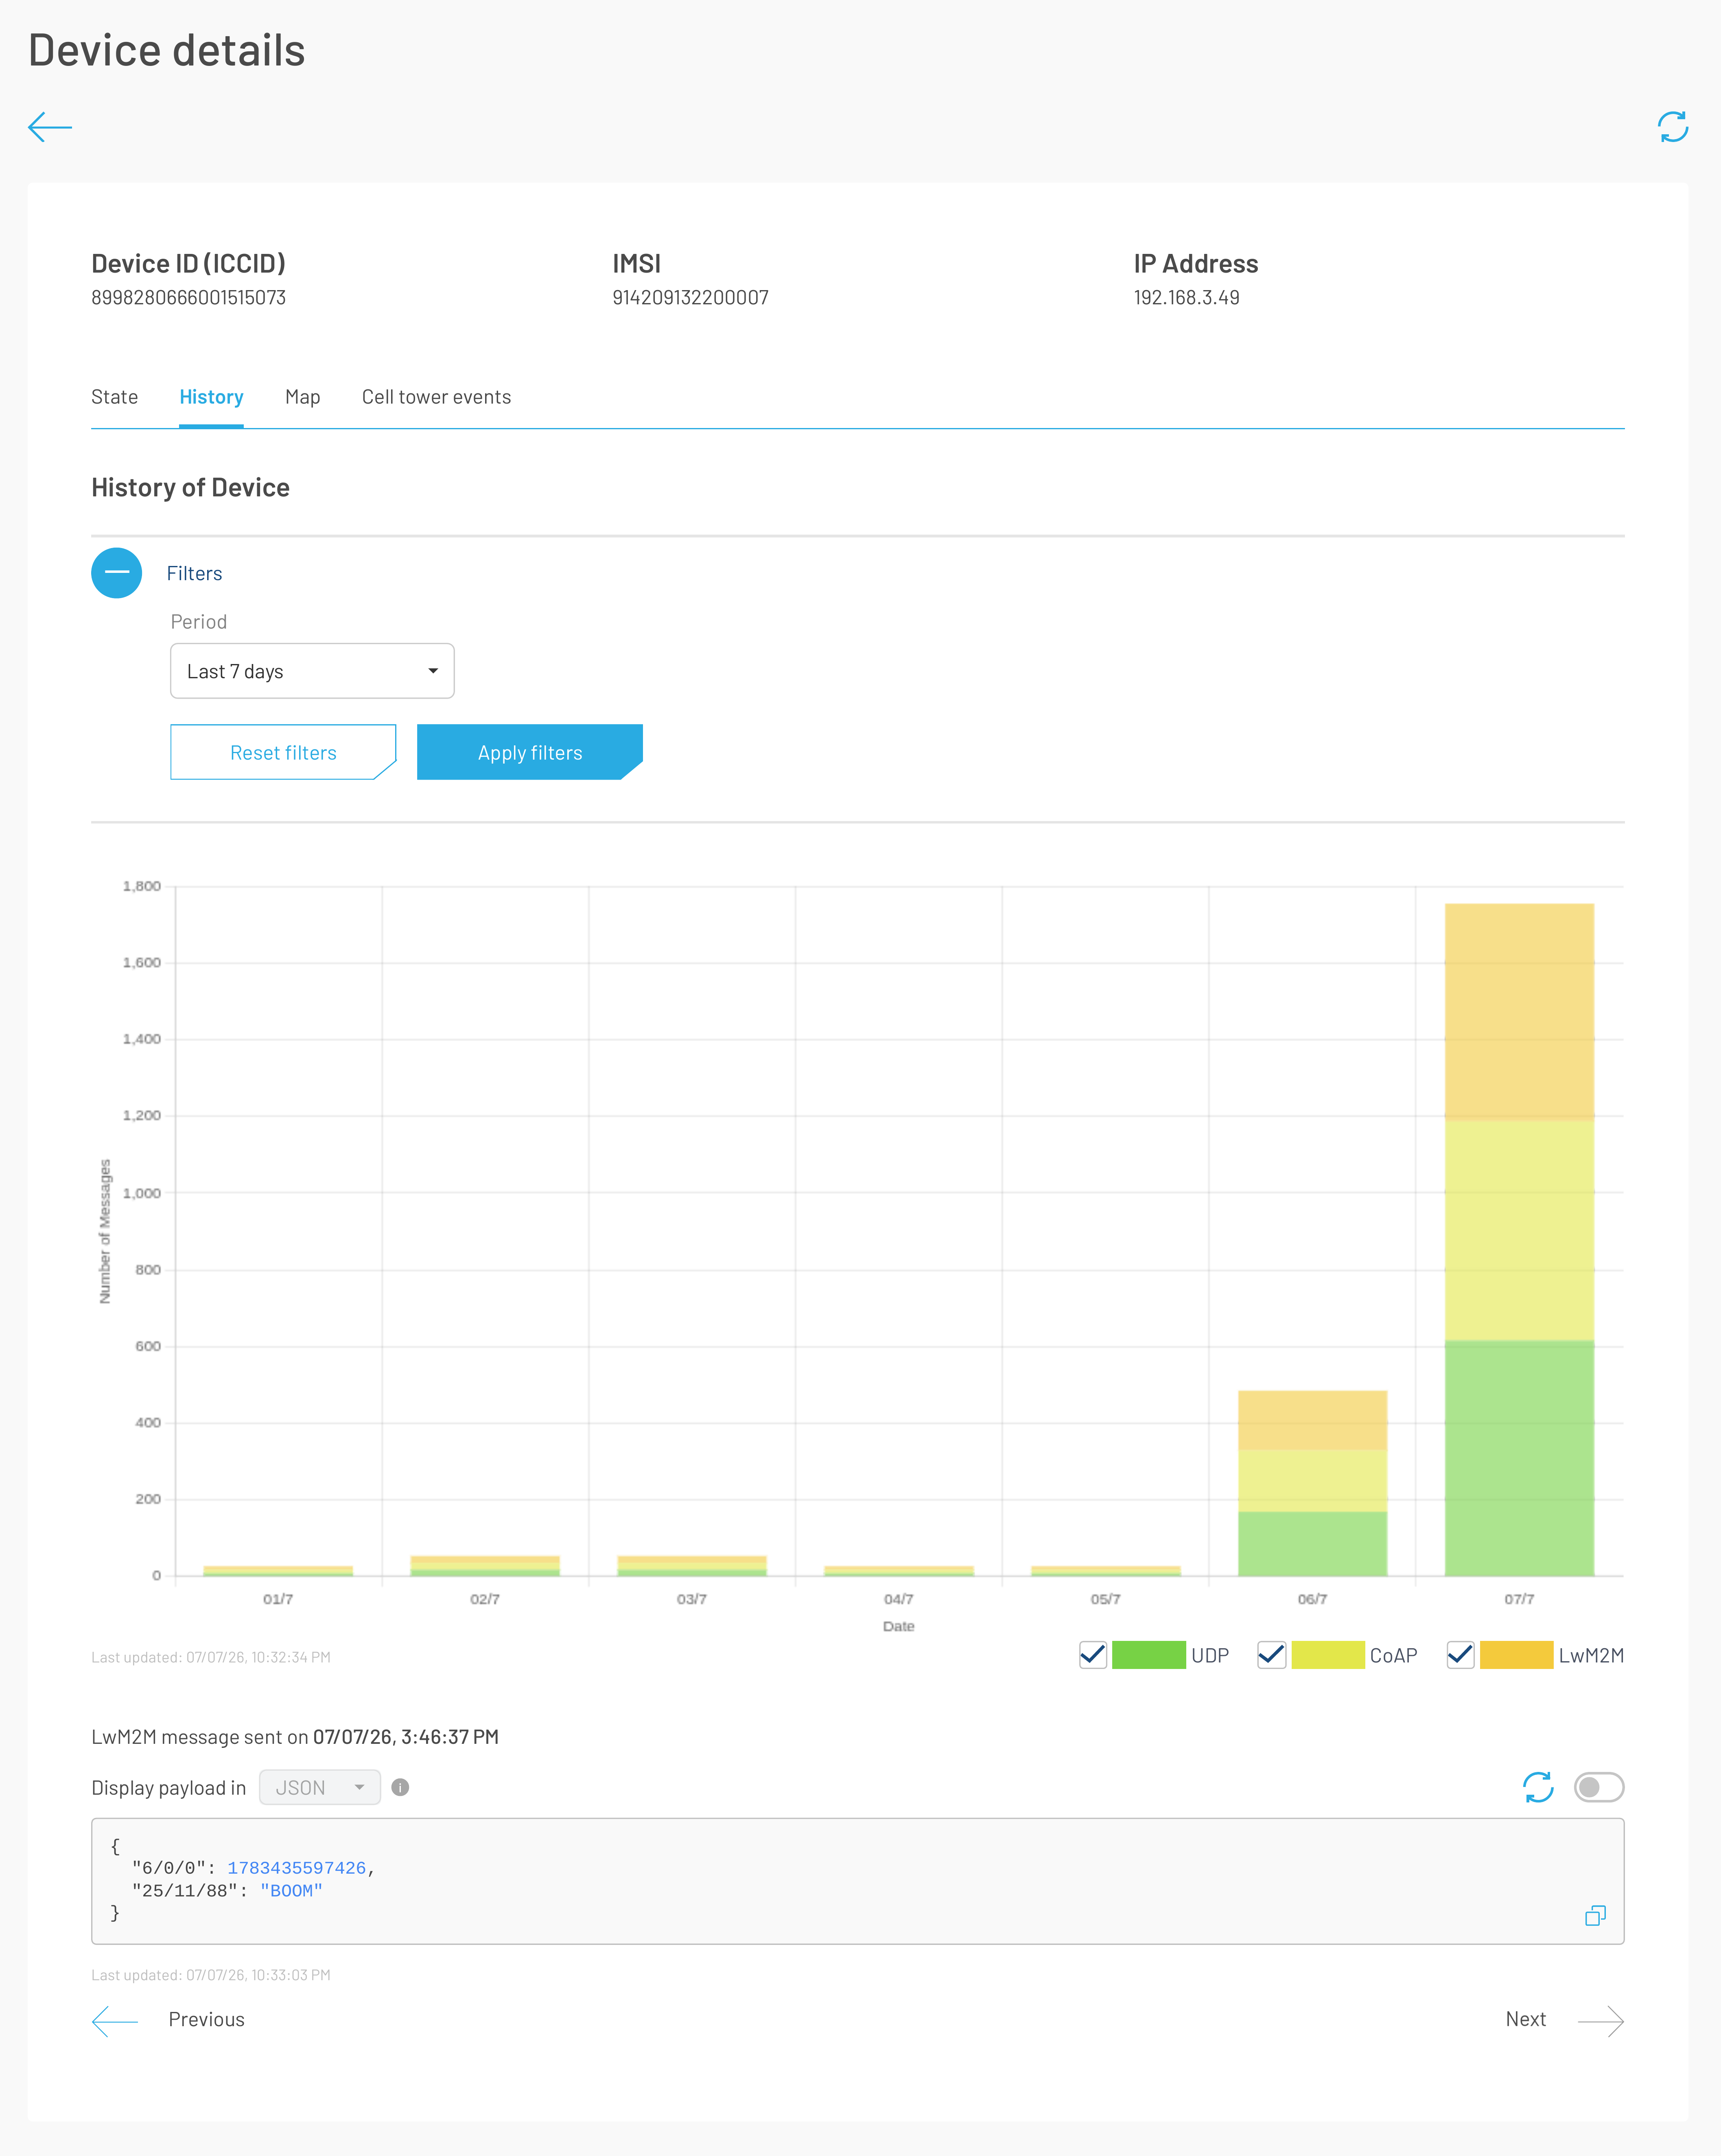
As mentioned, we can see the messages statistics of the last 7 days as well when we change the period selector above the chart:
Refreshing Data
The History tab provides controls to refresh message data without reloading the entire page. You can trigger a one-time refresh or enable automatic periodic refresh.
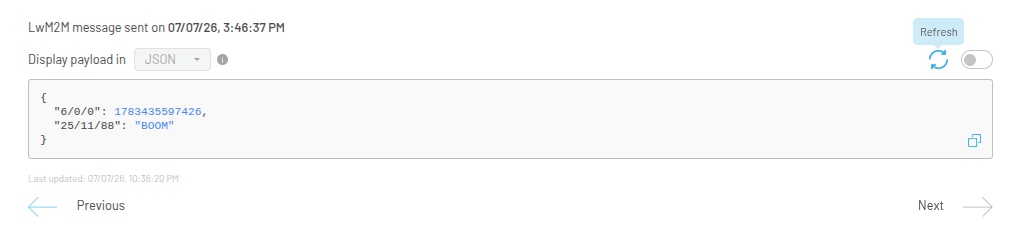
Manual Refresh Button
The History tab displays a refresh button in the messages/payload section header. Clicking it refreshes only the messages and payload data shown below the button — the chart statistics above are not re-fetched.
This is useful when you want to check for new messages without affecting the chart view or your current filter selections.
Auto-Refresh Toggle
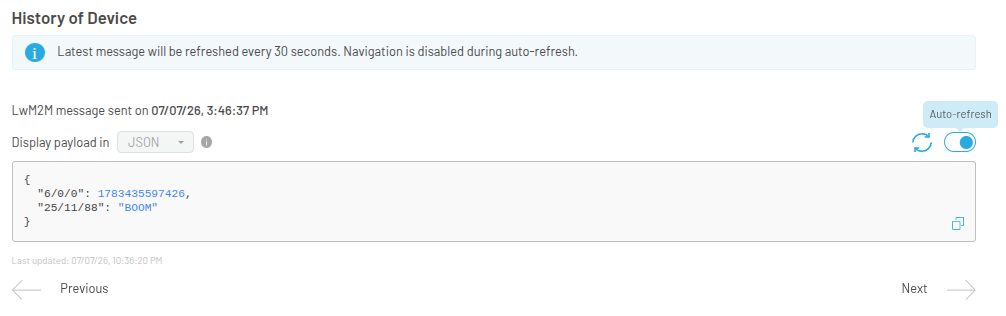
An auto-refresh toggle is located in the messages section header of the History tab. When enabled, the messages section refreshes automatically every 30 seconds, providing near-real-time monitoring of incoming device messages.
When auto-refresh is active:
- The chart/statistics section is hidden from view
- The pagination buttons (Previous/Next) are disabled
- An informative message is displayed explaining that data refreshes every 30 seconds, navigation buttons are disabled, and the latest message is always shown regardless of previous filter or graph selections
- The 30-second countdown starts after the previous refresh request completes (not on a fixed wall-clock schedule), so the actual interval between refreshes is 30 seconds plus the request duration
- The first automatic refresh occurs 30 seconds after enabling the toggle — the current data is shown immediately
When auto-refresh is disabled:
- The periodic refresh stops immediately
- The chart section reappears
- Pagination buttons become active again
Automatic deactivation:
- If an API error occurs during a refresh cycle, the auto-refresh toggle is automatically turned off
- When you navigate away from the History tab to another Device Inspector tab, auto-refresh stops automatically
The auto-refresh toggle is visible even when the messages section has no data (empty state), so you can enable it before messages arrive.